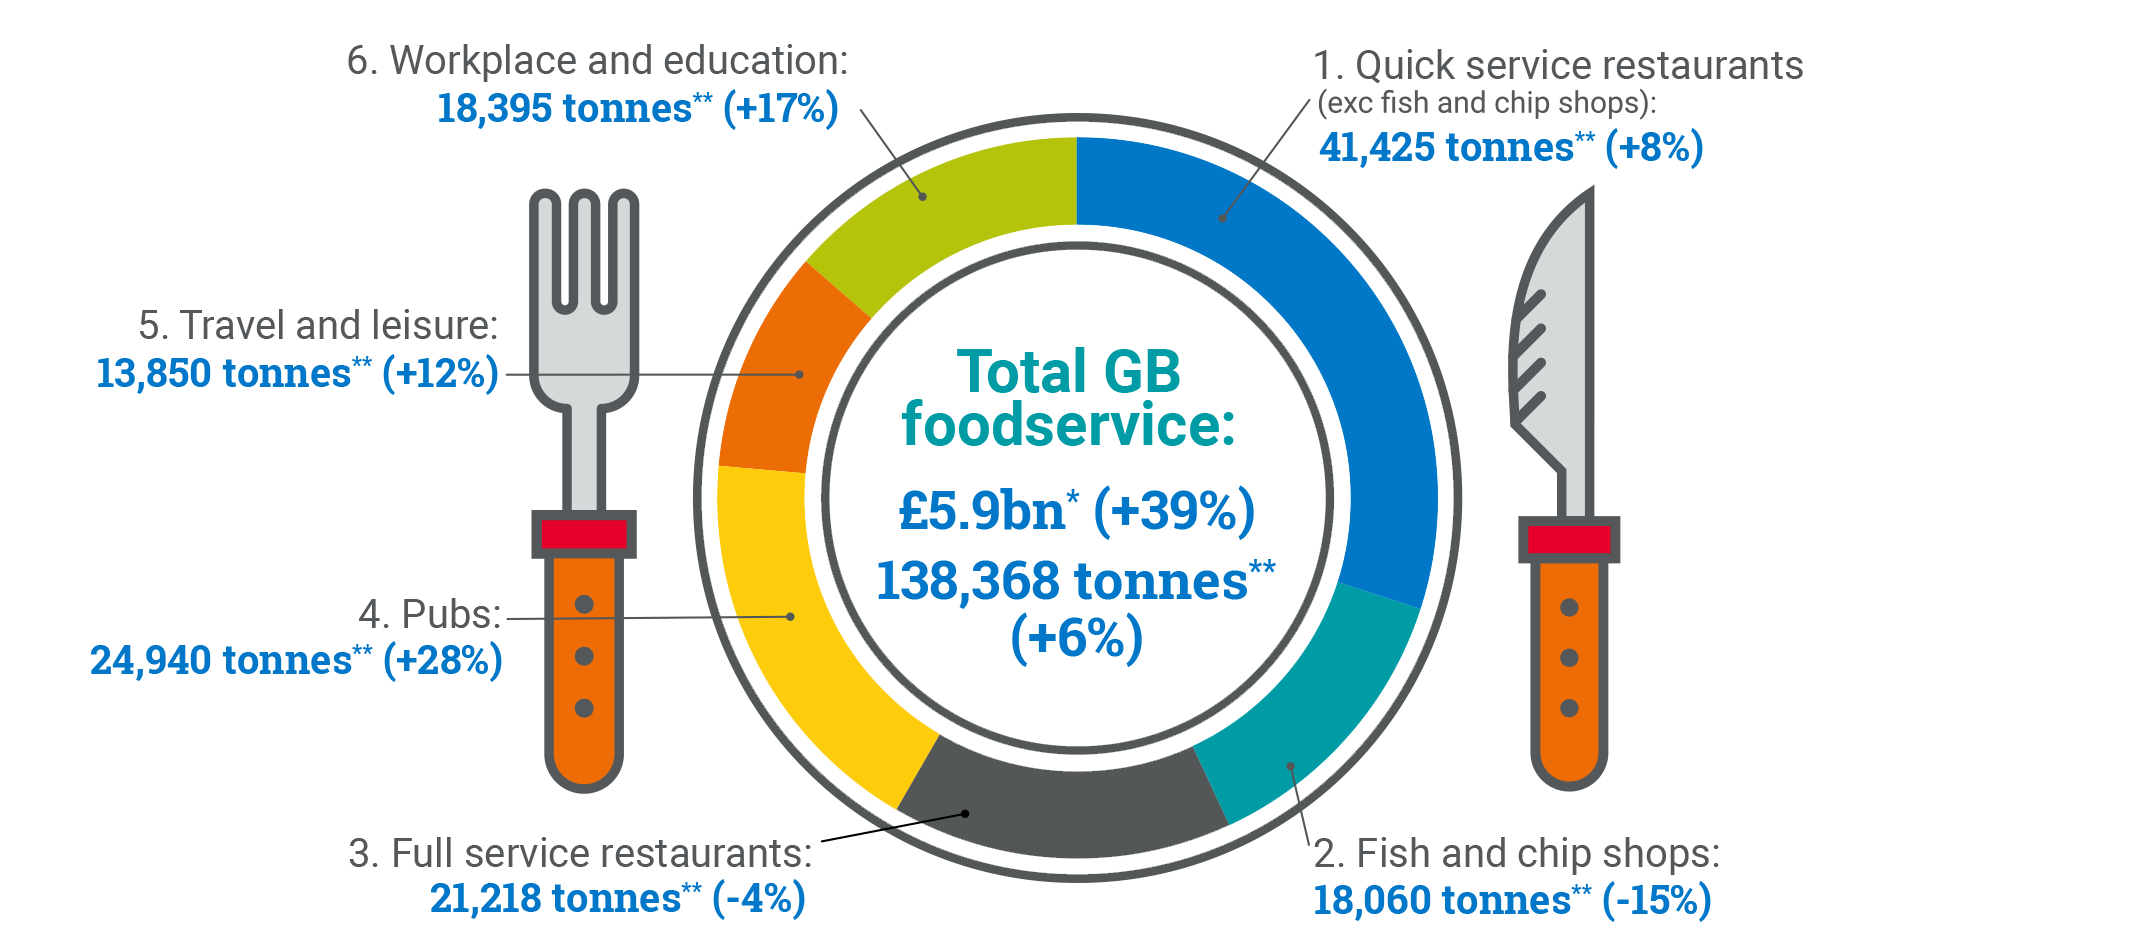
Seafood sold through foodservice
It’s better news for seafood in foodservice with an 6.4% increase in seafood servings.
Growth is driven by an uplift in seafood servings in pubs, and workplace and education centres. This includes restaurants, fish and chip shops, cafes,etc.

total BG food service:£5.9bn (+39%) 138,368t (+6%). 1 Quick Service Restaurant (excl. Fish and Chips Shops) 41,425 tonnes** (+8%) Fish and Chips Shops: 18,060 tonnes** (-15%) Full-Service Restaurants: 21,218 tonnes** (-4%) Pubs: 24,940 tonnes** (28%) Travel and Leisure: 13,850 tonnes** (+12%) Workplace and Education: 18,395 tonnes** (+17%)
*based on a small sample size.
**Tonnage
estimate = total servings x 140g portion size / 1000
Data notes and sources
Landings
Data Source: Marine Management Organisation.
Reference: MMO monthly landings statistics
https://www.gov.uk/government/
collections/monthly-uk-sea-fisheries-statistics
∙ A large pelagic trawler used for deep-sea fishing might weigh around 2,000 to 5,000 tonnes. So, if we take an average weight of 3,500 tonnes, 680,000 tonnes would be equivalent to the weight of around 194 large pelagic trawlers.
Fleet economic performance
Data source: Seafish
Reference: Seafish Fleet Enquiry Tool
https://public.tableau.com/app/profile/
seafish/viz/FleetEnquiryTool/1Overview
Note that 2023 performance and landings data is provisional
Aquaculture production
Data Source: Centre for Environment Fisheries and Aquaculture (CEFAS)
Reference: Data supplied directly to Seafish
Trade (Imports and Exports)
Data Source: HMRC monthly data via Business Trade Statistics (BTS), processed by Seafish.
Reference: Seafish Trade and Tariff Tool
https://public.tableau.com/app/profile/seafish/
viz/SeafishTradeandTariffTool
Overview
Note that 2023 trade data is provisional
Processing
Data source: Seafish
Reference: Seafish Processing Enquiry Tool
https://public.tableau.com/app/profile/
seafish/viz/ProcessingEnquiryTool/
Overview
Retail data
NielsenIQ ScanTrack data to 52 week ending 30/12/2023; Reference - Monthly Retail Report 52
week ending (w/e) data to 30.12.23; Link to report on MI Portal; Seafish.Org link to retail page and factsheets.
One Bird’s Eye fish finger weighs 27g and is 9 cm long. With 44,031 tonnes of fish fingers consumed in 2023, this amounts to approximately 1.63 billion fish fingers. Their combined length totals 146,770 km, which is about 3.66 times the Earth's circumference of 40,075 km.
Foodservice data
Circana data to year end December 2023; Reference - 2023 Q4 NPD Data Sheet; Link to report on
MI Portal; Seafish.Org link to foodservice page and factsheets.